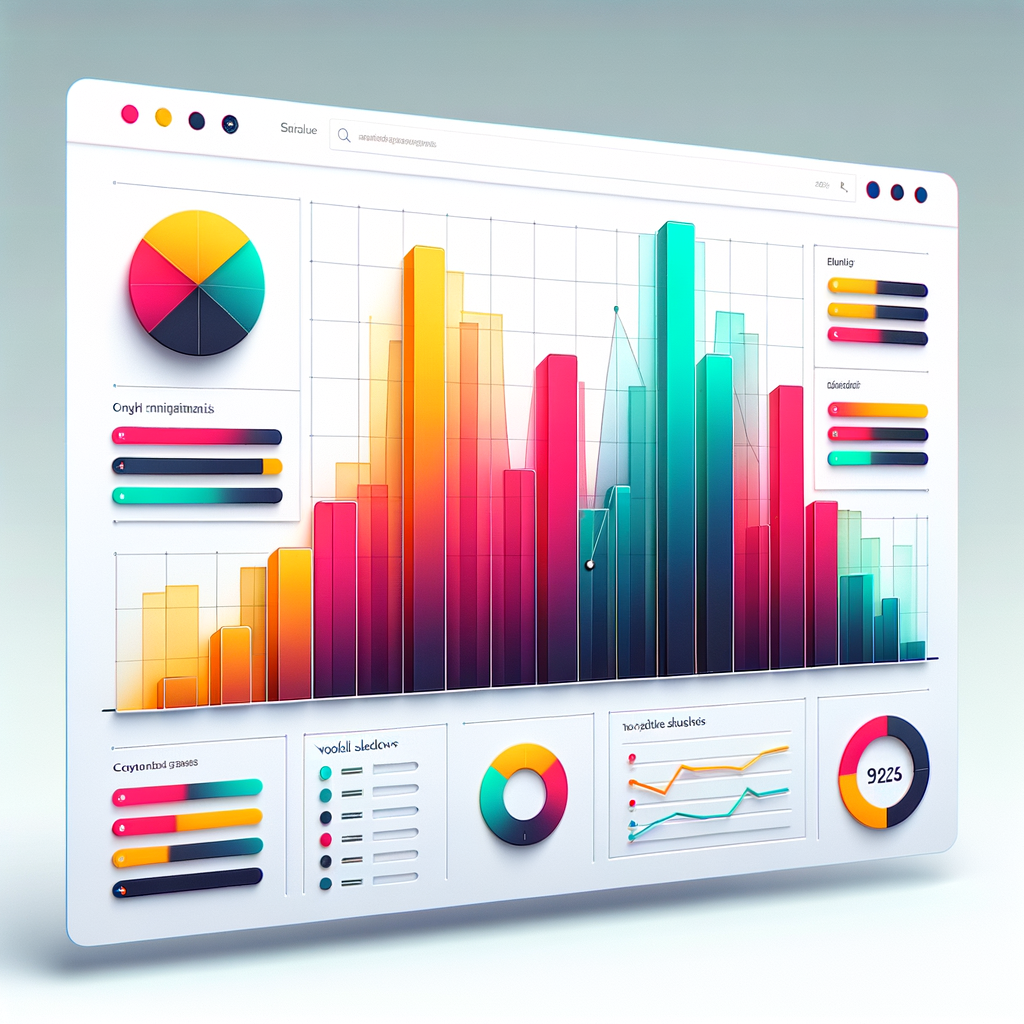
Modern CSS Functions Revolutionize Bar Chart Design
Today's major development in the design world centers on CSS-only bar charts and the evolving toolkit of modern CSS. As highlighted by CSS-Tricks, fresh CSS features are transforming how designers approach visualizations, making once-complex charts both accessible and enjoyable to code—without a single line of JavaScript.
What Happened
Bar charts have long been a staple in web design, used for everything from dashboards to data storytelling. Traditionally, designers relied on JavaScript libraries, SVG, or elaborate HTML/CSS workarounds to render them. However, a new article from CSS-Tricks demonstrates how recent CSS specifications, such as clamp(), min(), max(), and logical properties, have streamlined these efforts.
The article details several key techniques:
- Modern CSS Functions: By leveraging native CSS math functions, designers can dynamically adjust bar heights based on data attributes or custom properties. This approach allows for responsive, data-driven visuals without scripting.
- Utility of Custom Properties: CSS custom properties (variables) are now used to store chart data directly in markup or stylesheets. This enables scalable, maintainable, and easily updatable charts.
- Enhanced Responsiveness: Logical properties and new sizing units mean bar charts can adapt to different writing modes, screen sizes, and container queries seamlessly.
- Reduced Complexity: The reliance on JavaScript for simple data viz is diminishing. Pure CSS solutions now suffice for many common use cases, lowering barriers for designers who prefer to stay within the style layer.
The article presents working examples and code snippets, illustrating how these new CSS capabilities enable designers to build visually rich bar charts with minimal markup and logic.
Why It Matters
This development is significant for several reasons. First, it democratizes data visualization on the web, making it accessible to those without advanced JavaScript skills. Designers can now create interactive, animated, and fully responsive bar charts using only CSS, improving both workflow efficiency and site performance.
Second, it sets a precedent for what is possible as CSS continues to evolve. The use of modern functions encourages best practices and keeps visualizations lightweight. This is particularly important for performance-sensitive applications and mobile-first design.
Finally, as CSS grows more powerful, the line between design and development blurs further. Front-end professionals can now deliver sophisticated visual components while maintaining separation of concerns, making maintenance and collaboration easier.
Key Stats
- CSS bar charts can now be built with zero JavaScript, relying solely on modern CSS functions and custom properties.
- The article demonstrates dynamic bar heights using the
clamp()andcalc()functions, making charts responsive to data and layout changes. - CSS custom properties allow for easier data binding in markup, reducing the need for complex templating systems.
- Modern CSS supports logical properties and container queries, ensuring charts adapt seamlessly to various layouts and writing modes.
What's Next
With CSS’s capabilities expanding, we can expect further innovation in pure CSS data visualization. Upcoming features, such as CSS nesting and advanced selectors, may make charts even easier to build and customize. As front-end frameworks and design systems adopt these practices, the industry could see a shift towards more maintainable, performant, and accessible data visualizations—no JavaScript required.
Designers and developers alike should monitor browser support for these modern CSS features and begin experimenting to stay ahead of the curve. The future of web-based data visualization is likely to be lighter, faster, and more designer-friendly than ever before.